The question every marketing leader asks and few can answer
Most marketing teams can tell you two numbers with confidence.
How much they spent last month. And how much revenue came in.
What they usually can’t do is connect the two at the level where decisions actually happen: per event, per campaign, per night. That gap is where budget quietly leaks.
We see this pattern constantly. The data exists; it’s just scattered, and nobody owns the join.
Why marketing reporting breaks down
Ad platforms speak one language. Your business speaks another.
The major ad platforms report in campaigns, ad groups and ads. But a CMO doesn’t think in ad groups: they think in events, artists, venues, products.
So the real question: “how much did I spend on this event, and how many tickets did it sell?”, has no clean answer. The two sides never meet in one place.
The usual workaround makes it worse.
Someone exports each platform to a spreadsheet, pastes it next to a sales export, and stitches it by hand. It’s slow, it breaks every month, and every team ends up with slightly different numbers.
The result is familiar to most leaders:
Decisions wait days for a report that should take seconds.
Finance, sales and marketing quote different figures for the same campaign.
Marketing depends on the data team for even basic answers.
The cost isn’t just wasted hours. It’s budget spent on events you think are working, with no reliable way to prove it.
The approach: one governed layer, top to bottom
The fix isn’t another dashboard. It’s an architecture where ingestion, transformation, reporting and activation are one system, not five disconnected exports.
We recently built exactly this for a nightlife and events business that runs paid media across several platforms.
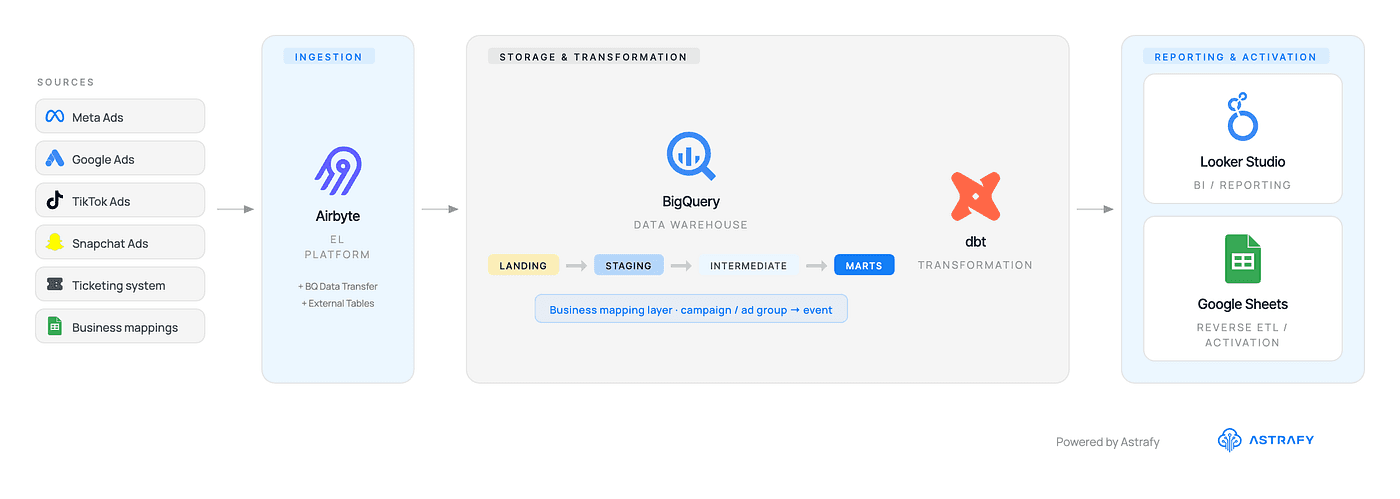
Figure 1. From fragmented marketing and ticketing data to a governed reporting and activation layer.
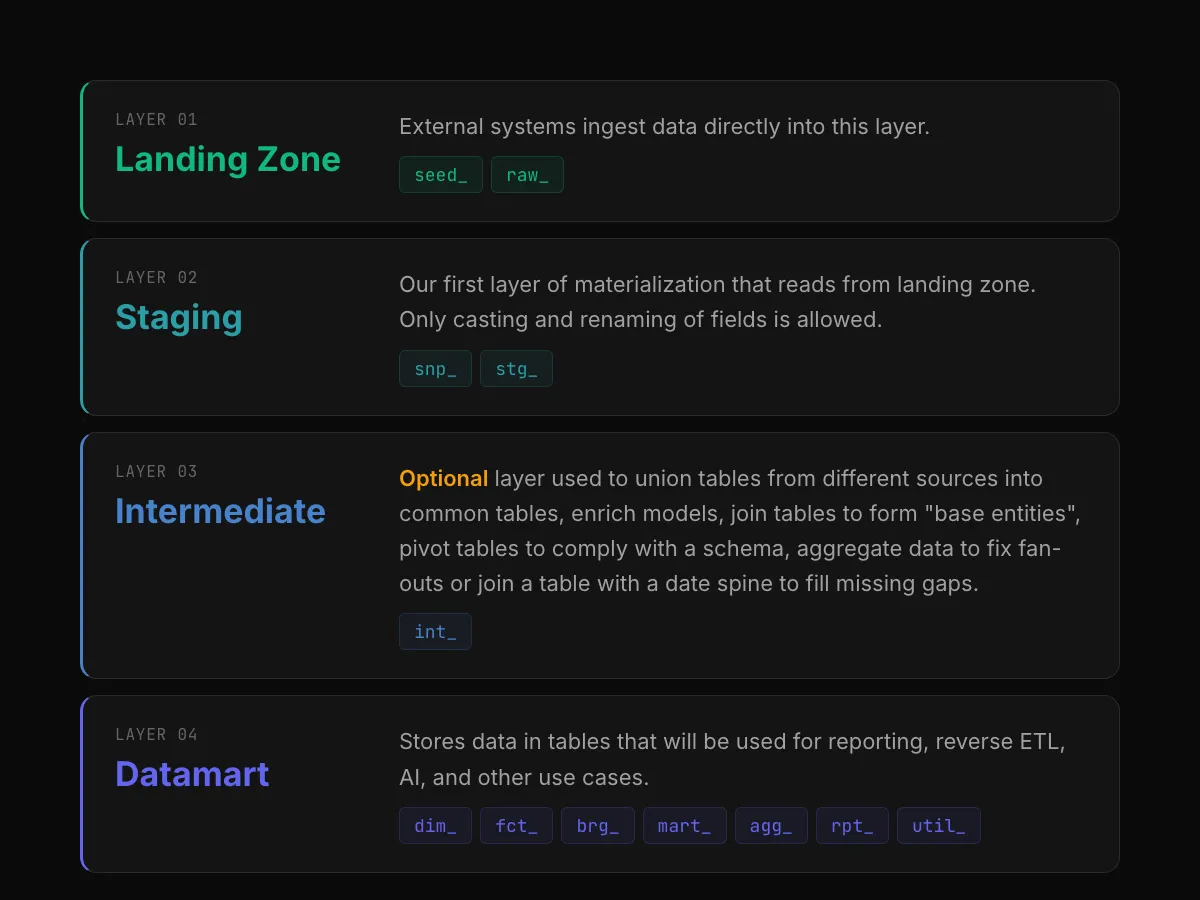
It works in four layers.
1. Ingestion. Each ad platform and the ticketing system land automatically in the cloud data warehouse. No manual exports.
2. Transformation. A modeling layer cleans and standardizes everything, then resolves the hard part: mapping each campaign and ad group to the real-world event it promoted.
3. Reporting. A single curated table joins ad spend to actual ticket revenue by event, by day. One source of truth, instead of five spreadsheets.
4. Activation. The answers flow back to where the team already works.
That mapping step is the quiet engine of the whole system.
It’s also where we’re honest about limits. In a recent project, logic-based rules resolved the large majority of paid-media spend automatically. The rest is surfaced into a light review queue, flagged for a human, never silently guessed.
That’s the difference between a system people trust and one they quietly route around.
Where the spreadsheet fits and why that’s a feature
Here’s the part most engineers get wrong: they try to drag marketing out of spreadsheets.
We did the opposite. The goal is not to remove the spreadsheet. It’s to stop the spreadsheet from becoming a disconnected shadow system.
In this project the spreadsheet works in both directions.

Figure 2. The spreadsheet remains familiar to marketing, but becomes a governed input and output of the data platform.
As an input, the marketing team maintains business knowledge about which campaign belongs to which event, directly in a familiar sheet. The warehouse reads it as a governed source, not a copy-paste.
As an output, an automated job pushes the fully resolved mapping back into that same sheet every day. The team opens a tool they already know and finds clean, trustworthy data waiting.
This is reverse ETL, but it’s worth saying out loud: reverse ETL doesn’t always mean Salesforce or a CRM.
Sometimes the right activation layer is the spreadsheet your team already opens every morning. The win is that it’s now connected, governed and consistent, instead of a fragile manual export.
The payoff for the business
The shift is from describing the past to acting on it.
Spend tied to revenue. Marketing can finally see return per event, not just cost per click.
Speed. Answers are ready when the question is asked, not days later.
Autonomy. The team self-serves in tools they already use, without queueing behind the data team.
One source of truth. Finance, sales and marketing finally argue about strategy, not about whose number is right.
A practical takeaway: if your team is still stitching ad exports to sales exports by hand, the problem isn’t your people or your tools. It’s that nothing owns the join between spend and revenue.
Ask yourself one thing. Could your marketing team, today, tell you the return on a single event without opening five tabs and a calculator?
If not, that’s the gap worth closing first.
Let’s talk
If this sounds like your reporting reality, reach out. We’d be glad to talk it through.