Blog
Data Modeling: Best Practices with BigQuery and dbt
Reading time.
4 min
Wrtitten by
Alejandro de la Cruz López
Data Engineering
When I interview data engineers, I always ask the same question.
What is data modeling?
The best I get is some vague explanation of how they use dimensions and facts. The most common answer is a long ehhhhhhh following something like: I use dbt for data modeling.
After living through this too many times, I have come to the following conclusion.
Data modeling is like teenage sex. Everyone talks about it, nobody really knows how to do it, everyone thinks everyone else is doing it, so everyone claims they are doing it.
The good news is that you are reading this. You will learn what data modeling is, how to build a great data model, and how to apply best practices to avoid turning your data model into a data pandemonium.
What is Data Modeling
Let’s start with what data modeling is not:
Data modeling is not a specific technology (
dbt,Airflow,Dagster)Data modeling is not where you store the data (
BigQuery,Snowflake,S3)Data modeling is not a specific approach or technique (
Kimball,One big table,Data vault)
Let’s then dive into my craft-made definition of data modeling.
Data modeling is the science and art of building an efficient, robust, adaptable, scalable, and maintainable data structure to serve business needs.
Sounds good, doesn’t it? But I want you to understand what data modeling really is, so let’s make a new definition being really concrete.
Data modeling is the process of designing tables and schemas to clean, merge, and transform raw data into accessible formats for downstream use cases such as reporting, AI, and automation.
Basically, it is deciding which tables you are going to create and how they will be structured in every step of your cleaning pipeline in order to build your final tables.
FAQ: Do I need to define every single table and schema before building anything?
Answer: No. It’s important to decide what business entities you will build in your final tables by understanding what your stakeholders need. Tables between your raw tables and final ones must follow some rules to avoid turning your data model into chaos, but can be defined along the way while you get new requirements.
Why is Data Modeling a Science and an Art
Because real-life data is messy. Really messy. You will never find clean and polished data modeling in a use case that has a minimal size. Many business rules are weird, and people interacting with systems don’t always think twice about how to add information to them.
I have seen companies with CRMs having email, email_1, email_2, email_principal, email_call… They then want to automate their reports, and each person is looking at one of them and wants to see exactly the same as they were seeing before.
Another fantastic requirement could be to merge customers based on an Excel file they update daily (manually, of course) because customers tend to create new accounts to get some discounts, and they want to track this.
Or, maybe, they want to track how marketing campaigns are influencing the sale of each product without a single column anywhere telling you which product is related to each sale. You may need to create a regex so long that even an LLM would have a hard time understanding. Or you may need to check the sale timestamp in the campaigns data and try to find the real order_id with some weird time-based logic.
Data is messy and will always be. Trying to find the perfect model for each requirement will turn you mad. We should always strive to do our best, but we need to keep in mind that it will be messy no matter how well we do.
This is the main reason that having good guidelines is extremely important. It will take out the burden of making every single decision with clear rules. Otherwise, every single decision will be a headache and turn into technical debt.
Data Modeling is also messy
Not only is data messy, but data modeling is as well. As with any art, there are a million opinions on how to best do data modeling. This blog is a practical guide on the strategy and mental map to follow when you are designing and working with your data model.
If you are already working on a big enough project, chances are that you cannot simply refactor it all to apply all the strategies in this guide. The best you can do is understand the strategy so that you can adapt it and define your own strategy with a strong knowledge of what a good data model looks like.
Why efficient, robust, adaptable, scalable, and maintainable
Efficient: Use the least amount of resources possible for the use case.
Robust: Can handle errors and recover from them.
Adaptable: It needs to serve new use cases easily, without changing the whole structure of the data.
Scalable: It needs to work if data grows exponentially.
Maintenable: You are not writing code for yourself. Understandability is key to ensuring effective collaboration. Prioritize the simplest solution.
Data Modeling Strategy
Most of the work in data modeling lies in understanding business concepts, reducing ambiguity, designing reusable and standard tables, and conveying business realities into a maintainable and reusable data model that serves business needs.
This guide is not focused on that. This guide is technical. Once you know what business realities you want to model, this guide will help you build all the workflows needed to arrive at your final tables. It will give you the standards and tools to offload all that mental work into a set of common rules, allowing yourself to focus on what matters and avoiding technical debt.
We will cover the following points:
Approach/Methodology
Layering
Model Types
Intermediate Layer
Column Naming
Style Guide
End-to-end Example
Approach/Methodology
There are several methodologies to use for data modeling. The most famous ones are Kimball, One Big Table, Data Vault, and Inmon. We will use the Kimball methodology.
If you are not familiar with Kimball methodology, I suggest reading the first chapters of the Data Warehouse Toolkit to get a grasp of how it works.
As a quick introduction, the Kimball data model (or star schema) models the data into a star schema, having a central fact tables (measurable business metrics) surrounded by denormalized dimension tables (descriptive context).
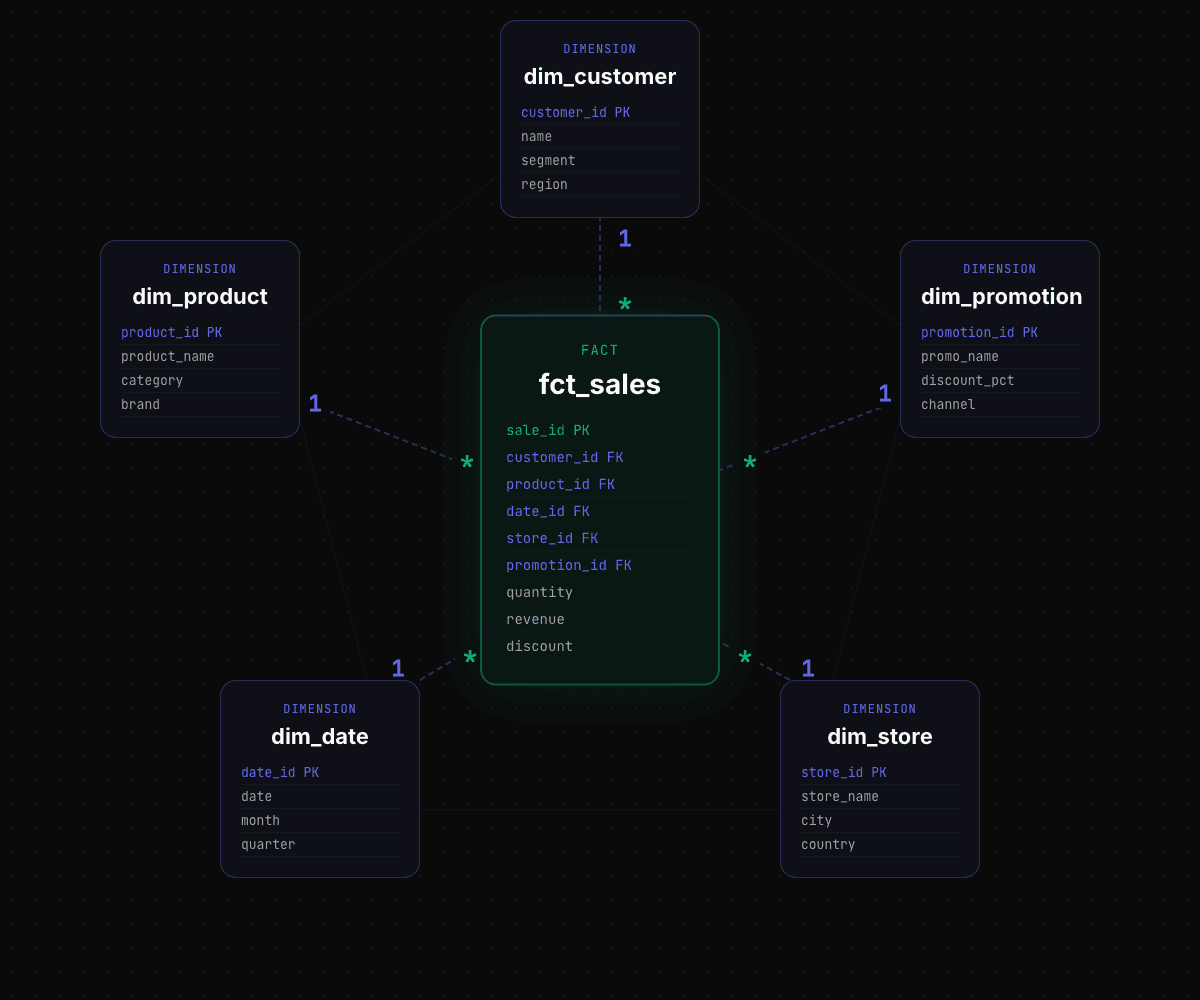
Star schema
Why Kimball?
The goal of this article is not to go over every single data modeling approach with a list of pros/cons. However, here are the reasons to choose Kimball:
It has become the standard in data modeling approaches. It is the most commonly used, and in most projects, you can see people defining dimensions and facts without even knowing they are using the Kimball methodology.
It has a great balance between complexity, maintainability, and adaptability. It is a rather simple approach compared to Inmon or Data Vault. Besides, it is very adaptable and easy to extend, which is an essential characteristic in data because you know it will be messy. It is also very simple to understand, which makes it very maintainable.
Of course, choosing another methodology is not wrong per se, and it will depend on your use case. But in 95% of the cases, you won’t get it wrong with Kimball.
Defining business entities
In the Kimball methodology, we need to define our business processes and entities and turn them into facts and dimensions. This is an essential point. Facts and dimensions must be business entities, not source systems.
For example, imagine a business that sells concert tickets. They may use different platforms to sell them, and we are ingesting data from all of them. Our dimensions and facts must be general entities, not tied to a source. We will have dim_customers and fct_sales as general entities, and they will aggregate data from the different source systems together.
We need to make a heavy effort not to create a new table every time we have a new requirement. This is a common approach, but it never turns out well. It creates a lot of technical debt, and the system eventually becomes unmaintainable.
In the model types section below, we will explore how to deal with complex logics that require the creation of new models. The key rule is keeping Kimball models small and simple. Our facts and dimensions must be minimal and general so that they can be reused for many use cases.
Layering
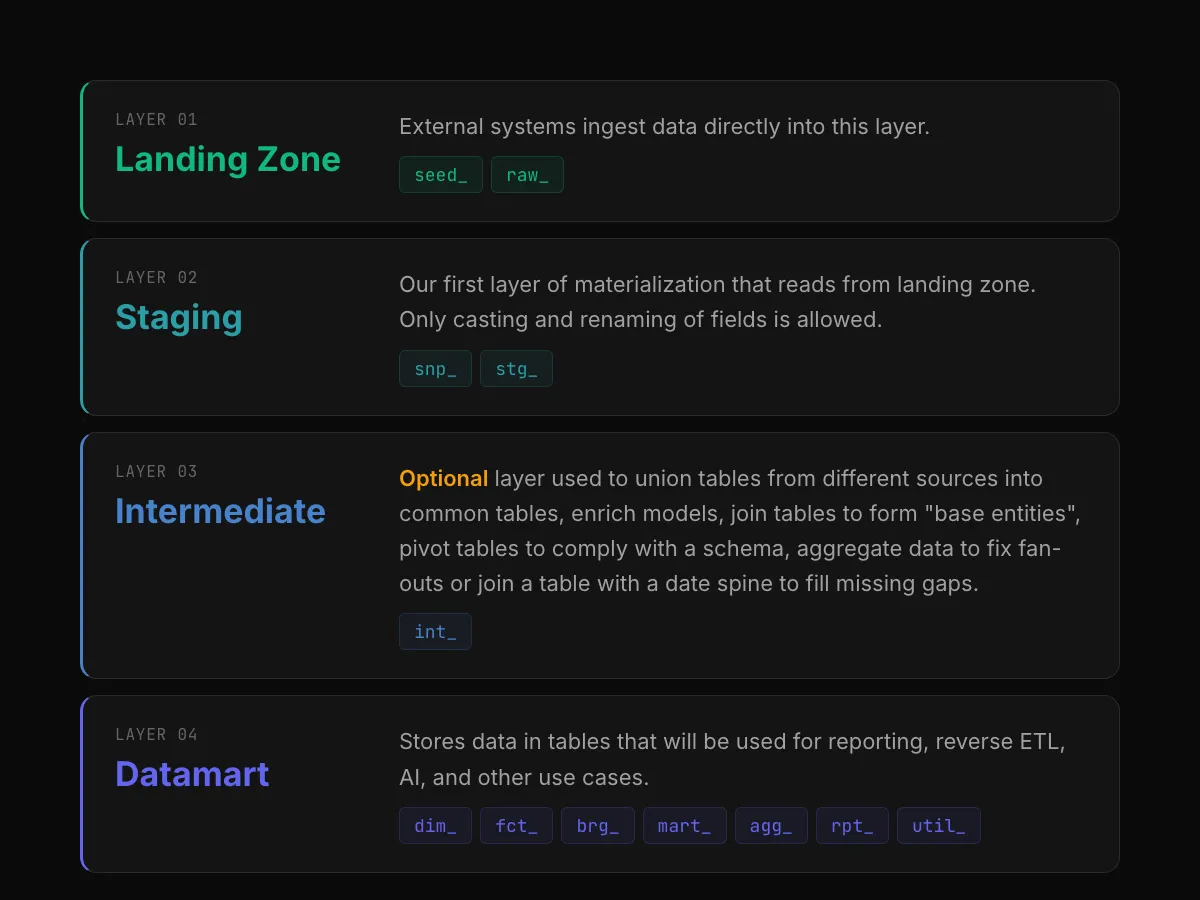
Layering refers to the different stages our raw data will pass through in order to arrive at the final analytics-ready models. We use the common standard of having 4 layers.
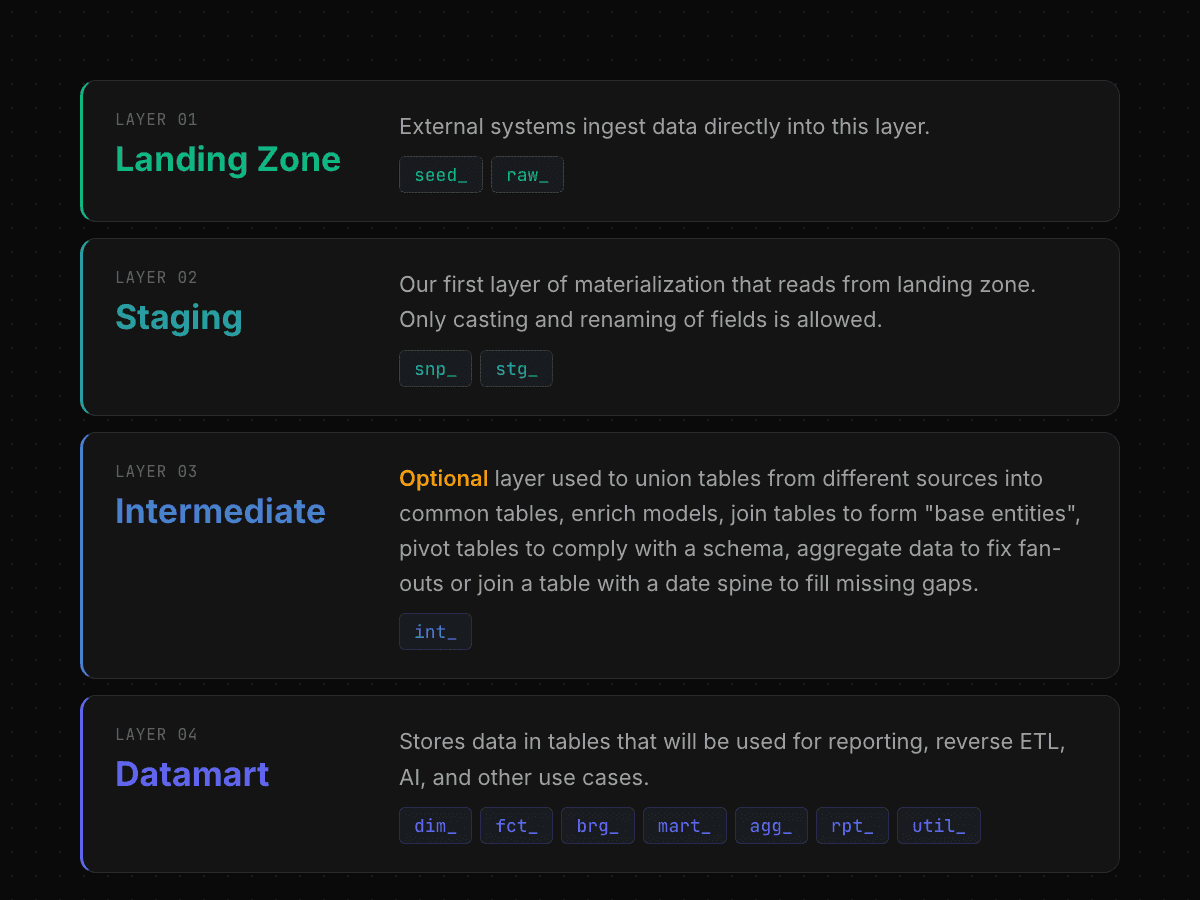
Data Modeling — Layers
The reasoning behind the need for these layers is the following:
Staging: We need to standardize our data to comply with all our styling, naming, typing, and semantic rules. By having a pass-through layer with these changes, we enforce its usage and avoid future problems in the final layers. For example, joining fields with mismatched types or having columns referring to the same business concept with different names.
Intermediate: This layer is optional. Sometimes we can do our job just by creating dimensions and querying the staging layer for
facts. However, many times we need to prepare the data, join with other tables, union different sources… Doing all these transformations in the intermediate layer allows us to use them in different downstream models and simplify the complexity of dimension and fact models.Datamart: These tables are accessible to stakeholders via your Data Warehouse, a BI tool, an internal application, or any other system. Therefore, it is the most important layer and the one we must work on the most.
DimensionsandFactsare the entry points of this layer. We should first build these models, and the rest of the models in this layer will be built upon them.
Model Types
On each layer, we will use a common naming pattern for the models. This helps maintaining clarify and identify rapidly the purpose of the model and its nature.
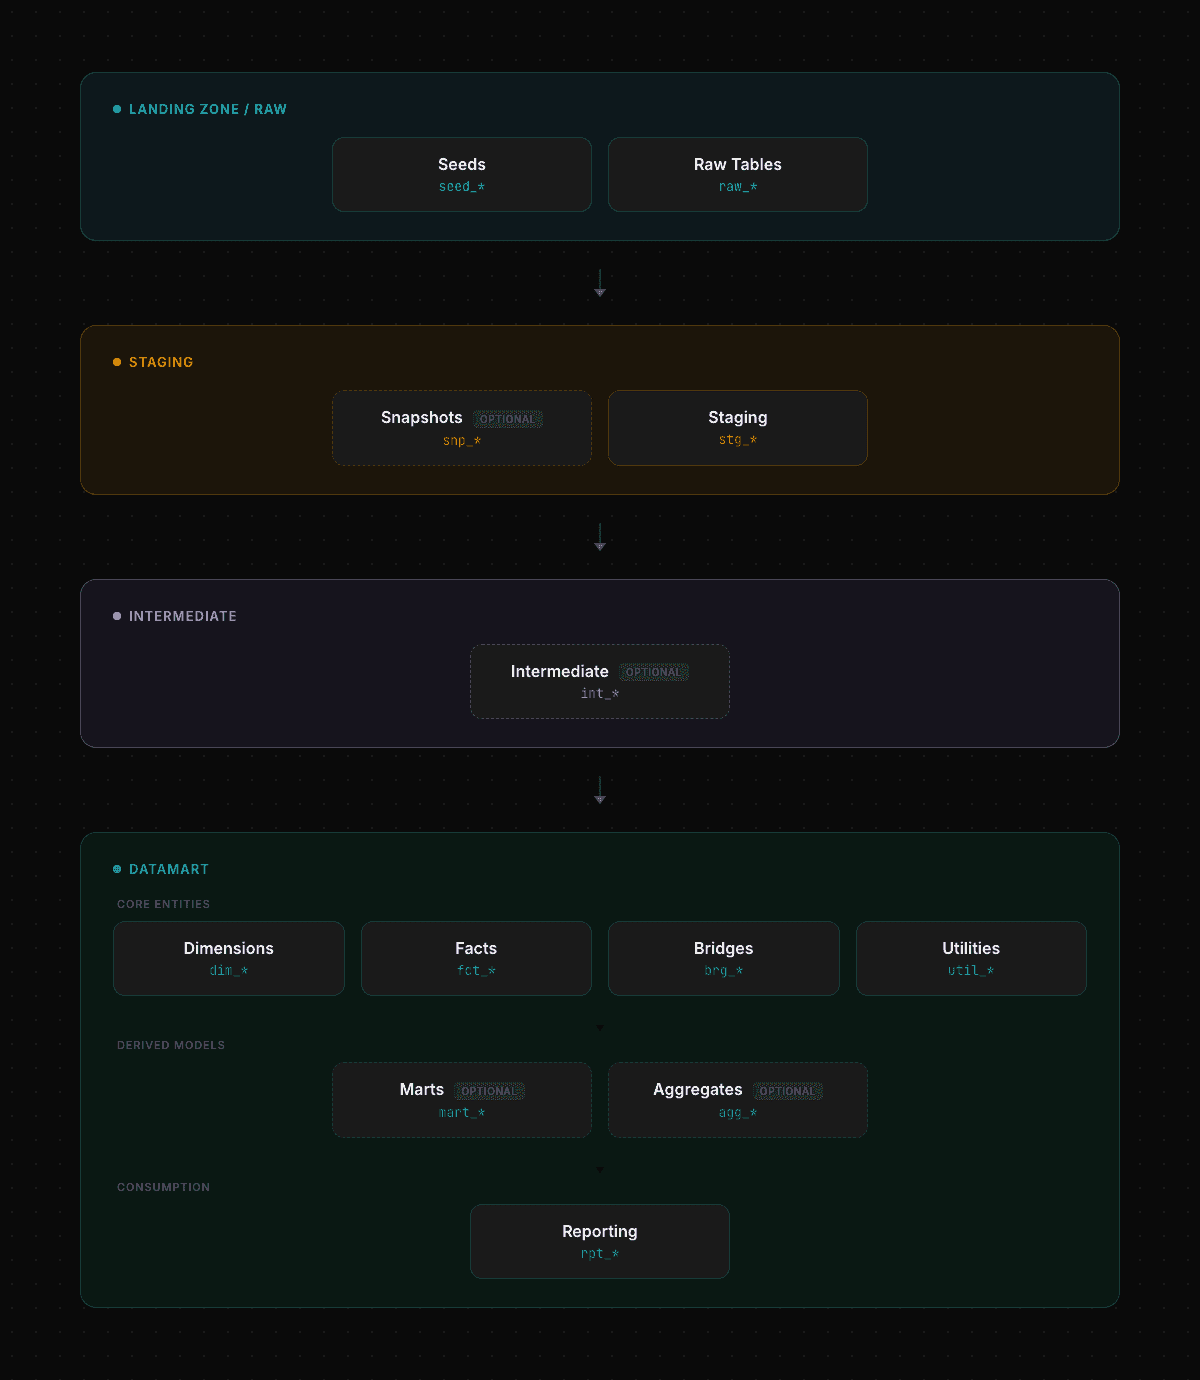
Data Modeling — Model types flow
Landing zone
Seeds are fixed files that are materialized in our Data Warehouse. They are useful for mapping rules such as country codes.
Raw tables are the data we are ingesting from different sources, such as APIs, databases, CRMs, etc.
Staging
Snapshots: Many requirements force us to track changes from tables that do not provide us with the change lineage, but just a snapshot of the current data. In these cases, we need to build a snapshot that tracks each row and its changes over time. We keep this snapshot as close as possible to the raw data for a simple reason: if business rules change, we risk changing all rows from an entity, which will force an update of all rows in our snapshot. By keeping it as close to the raw data, we minimize the number of non-data-related changes.
Staging: Staging models are named the same as the staging layer. It is a passthrough layer enforcing types and naming.
Intermediate
As this is a complex layer, we will deep dive into it in the following section.
Datamart
Having just dimensions and facts is not enough most of the time. They should be the first models we build on the datamart layer, but we will need to build some others upon them. For this reason, we establish some other types.
Utils: Models for utilities such as a date spine.
Bridges: Contains
N:Mrelationships.Marts:
Dimensionmodels that need extra processing that do not belong to adimension(such asfactaggregations, eg, total sales per customer)Aggregations:
Factmodels that need extra processing that do not belong to a fact (such as changing the grain).Reporting: Models built for a specific dashboard or use case that require very complex logic. This is not meant to be reused. For example, a cohort analysis.

Data Modeling — Model types
Intermediate layer
The intermediate layer is optional. In most cases, you can get away with querying the staging layer from the datamart layer directly. And you should! Making things as simple as possible is essential.
Deciding what goes into this layer is complex. Every company and data model is different, and it has different needs. However, we set up this structure to have a holistic view of (almost) everything that you could encounter and how to deal with it.
Simple Modeling
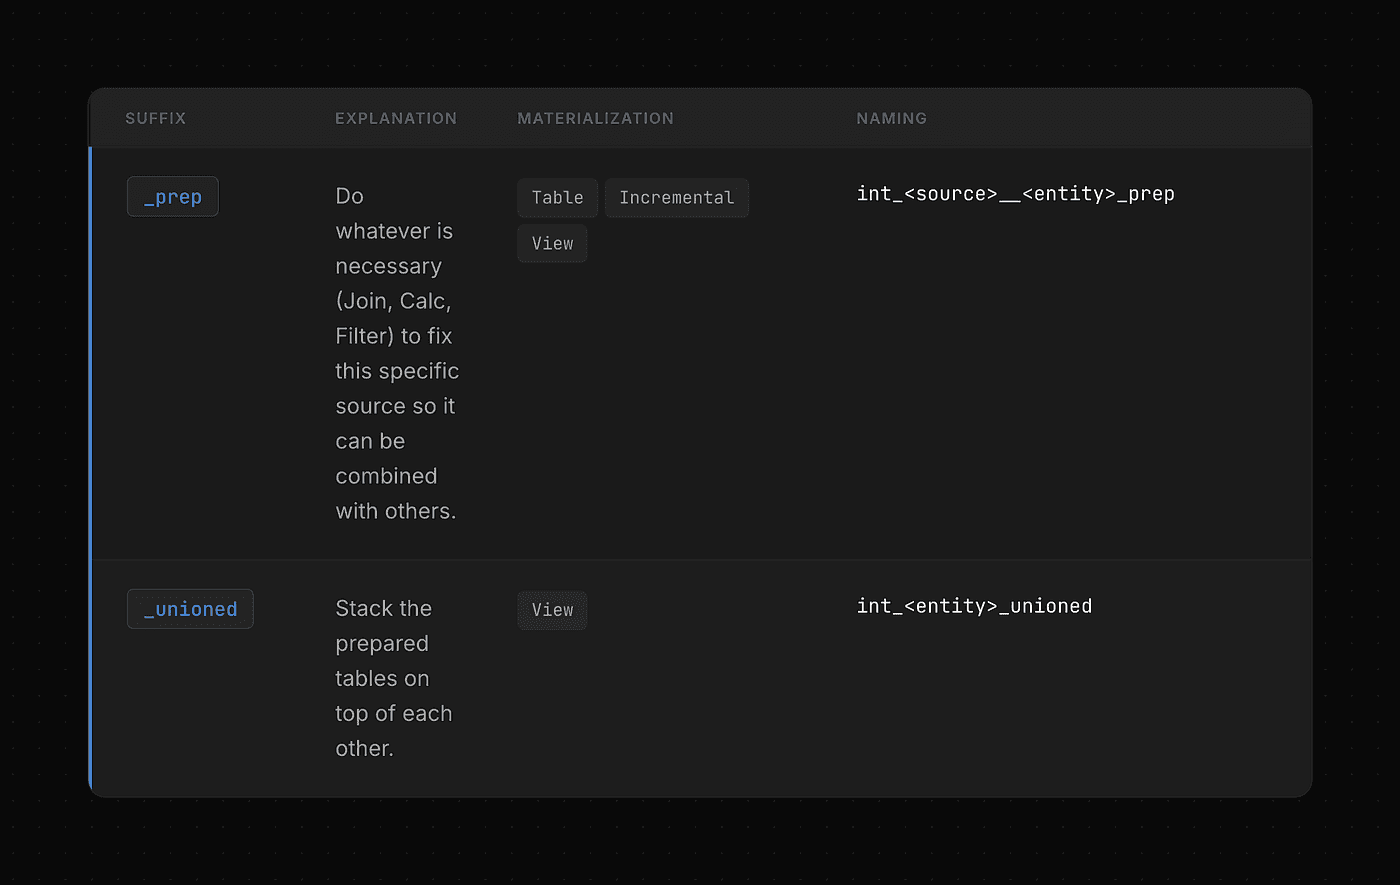
Prep tables applies source-specific business rules before it is unioned/joined. If some business rules must be applied to all systems, they must go into dimension or fact tables. Ask yourself: Should I apply this logic to all sources or only to this one? For example:
There are a
salesandsales_informationtable.The relationship is
1:1Another sales table from a different source system has all this information in one table.
We will join them in
int_<source>__sales_prepThen union both sales tables in
int_sales_unioned
Unioned tables unions different tables of the different sources that create an entity.

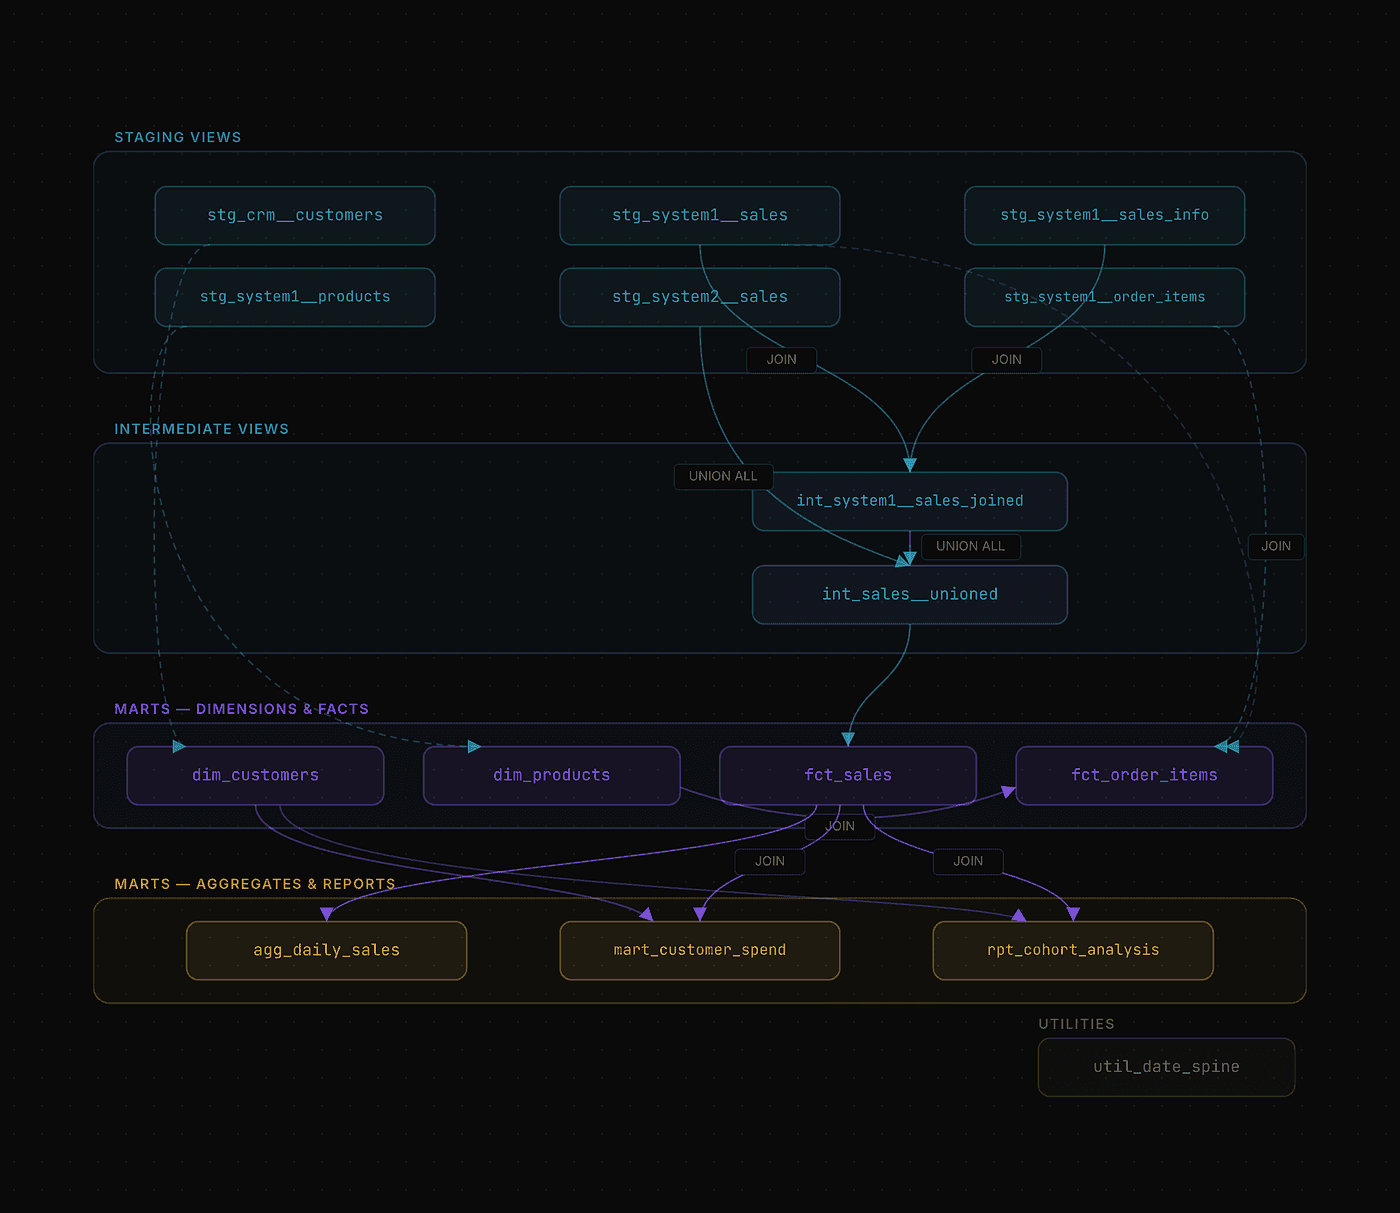
Data Modeling — Intermediate Layer Simple Modeling
Advanced Modeling
As said, in most cases you won’t need to use these. If logic becomes too complex and you need to start splitting up models at an intermediate level, you can use these patterns to maintain consistency.

Data Modeling — Intermediate Layer Advanced Modeling
Column Naming
One of the key parts of data modeling is column naming. It helps greatly to understand what type each column is and its purpose just by reading its name. These are some general rules:
Avoid abbreviated names. Use
customer_idinstead ofcust_id.All columns referring to the same concept should have the same name. For example, in an order’s table, you may have
order_dateandorder_type. If we create a new table grouping orders by date and order type, these columns should be called the same.

Data Modeling — Column Naming
Style Guide
Styling the code is often underrated. It is a fairly simple task that provides a lot of organization and understanding between different collaborators in the project.
I recommend using dbt’s style guide, slightly adapted to your needs. For example, we have added the following rules:
For multi-package dependencies, always include the package name. Use
{{ ref(‘my_package’, ‘my_model’) }}over{{ ref(‘my_model’) }}Prefer
group by allover listing column names.Prefer
union all by nametounionunless you explicitly want to de-dupe.
Enforcing these rules is not always easy. Unfortunately, there is no single software that can check all these rules and alert you when they are not being followed. However, we can get close by using pre-commit, sqlfluff, and AI skills.
Pre-commit allows you to run a set of checks before committing your code to avoid committing wrong or inconsistent code. SQLfluff is a great check to include so that your code is formatted and follows your rules and conventions.
On the other side, AI skills allow you to define your rules with natural language, develop enforcing those constraints, and check code so that it complies with them. You can see an example of all these in the example.
End-to-end Example
In the following GitHub repository, you can find an example repository following this data modeling strategy.
Data Modeling — Example
AI-powered development
Of course, remembering all these rules is not an easy task. We use AI to help us identify disconformities and to build the models directly with minimal human intervention. This workflow has allowed us to greatly reduce our development time while increasing quality and reducing tech debt. We used the skill inside the example repository. However, if you want to use the latest version, you can take a look at all our published skills.
Conclusion
Of course, data modeling is not simply plugging in an AI skill and conforming to a set of rules. Most of the work relies on understanding business concepts, reducing ambiguity, designing reusable and standard tables, and conveying business realities into a maintainable and reusable data model that serves business needs.
This guide is technical, even though the technical aspect of data modeling is about 25% of the work. Getting wrong requirements or failing to integrate the reality of the business into the data model is far more catastrophic than building random tables here and there.
Therefore, the goal of this guide is to abstract the technical side with simple and scalable rules to avoid technical debt from growing exponentially. This frees your mind to focus on going deep into the business day-to-day operations to draw a fair and effective picture.
No more “I don’t know where this table should go”. Now you can use this time on “What is the most effective way to solve my stakeholder problems with this data?”
Written by

Alejandro de la Cruz López
Lead AI Engineer


