Blog
Data Stack Cluster accelerator
Reading time.
1 min
Wrtitten by
Charles Verleyen
Data Engineering
Infra & DataOps

Introduction
The most famous data technologies are open-source (OSS), which is one of the main reasons they became famous in the first place. This is significant because it means that any company, regardless of its size, can have a state-of-the-art data stack and operate at the same efficiency as larger companies. Accessibility to the best stack at almost no cost with unlimited power from cloud providers in “pay-as-you-go” pricing models has been a catalyst for startups and SMEs to innovate and compete in the tech world.
In theory, yes — in practice, it’s a bit different. Deploying those OSS technologies requires quite some infra and DevOps skills. Running an OSS tool locally is one thing, but deploying it in the cloud with production-ready features like security, monitoring, and auto-scaling is a completely different challenge.
So, in practice, the decision often boils down to the skills of the data and IT teams to deploy those OSS tools. Often the decision goes towards fully managed versions of those OSS tools with license costs and loss of flexibility. The goal of this article is not to be critical toward fully-managed solutions of OSS tools but to present an alternative solution when you lack the technical skills to deploy OSS solutions.
We have been there many times on various projects and have built, throughout the years, an accelerator using Kubernetes to deploy OSS data solutions seamlessly with enterprise-grade features.
Business context
Before diving into the accelerator and its technicalities, let us take a step back and understand the context in which such an accelerator is necessary business-wise. The current data landscape is packed with dozens of tools for each data activity. The following picture (not meant to be readable) depicts the state of the data stack tools in 2023:

It is definitely overwhelming, to say the least, and the complexity today lies in choosing the right tools and integrating those tools properly so that data can flow smoothly from ingestion to distribution.
With the amount of tools present on the market, the decision of “buy versus build” often goes towards “buy” and actually, with the fact most popular tools are OSS, the decision goes to a third option, which is “deploying OSS tools effectively/efficiently”. The entire purpose of this accelerator is to jump-start deploying those data tools on Kubernetes so that you can avoid all the boilerplates and burden of infrastructure and DevOps related to such deployments.

This accelerator can accommodate any kind of OSS tool. It is important to note that the selection of tools needs to be taken at a strategic level when designing your data stack. In this article, we will mention our preferred data stack, which works pretty well, but hundreds of other combinations of stacks are possible. The takeaway here is that you should not rush this step and that the tools selection should be part of your data strategy and tools should be chosen based on different factors within your company (company size, IT skills of employees, company culture, etc.) and should not be chosen based on market hype. Too often, companies rush into the latest data tool to notice down the line that the tool on its own won’t do much if the entire data ecosystem is not aligned. The PPT framework is interesting in that sense. It states that People, Processes, and Technology must work harmoniously for successful business operations.
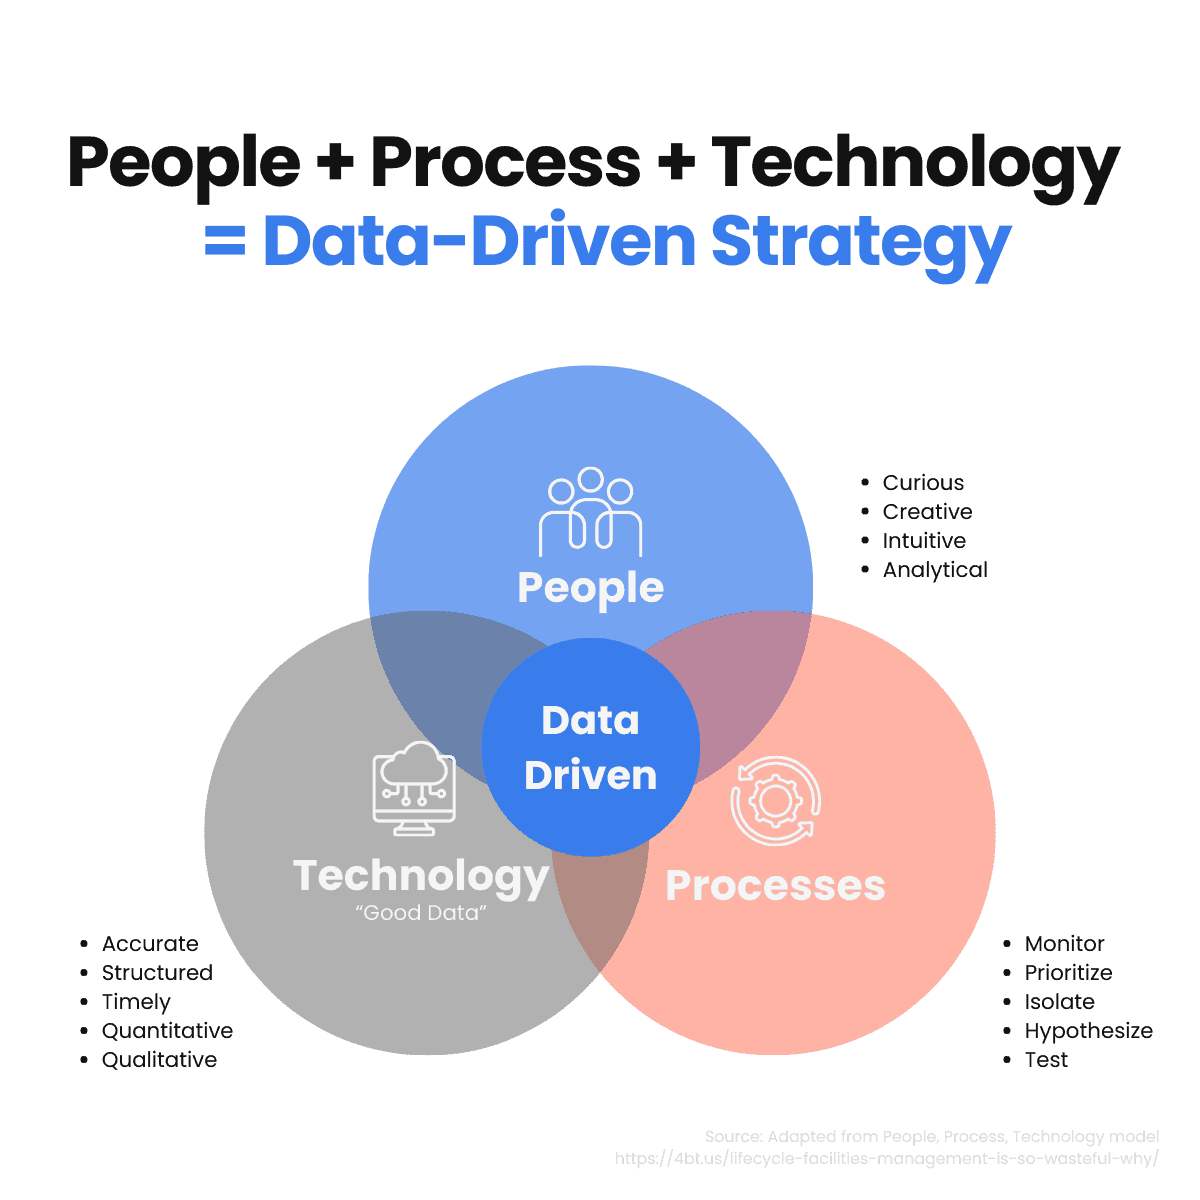
In the world, companies tend to put a lot of weight on the “technology” aspect while disregarding the “People” and “Process” aspects. This leads many data initiatives to fail.
With that caveat in mind, select tools that work well together and are a good fit for your company. The stack mentioned in a section hereafter is generally a good fit for startups and SME companies that want a best-of-breed data stack with a steep learning curve.
What is actually a data stack?
A data stack is a collection of data management technologies and tools that transform raw data into useful information for business decision-making.
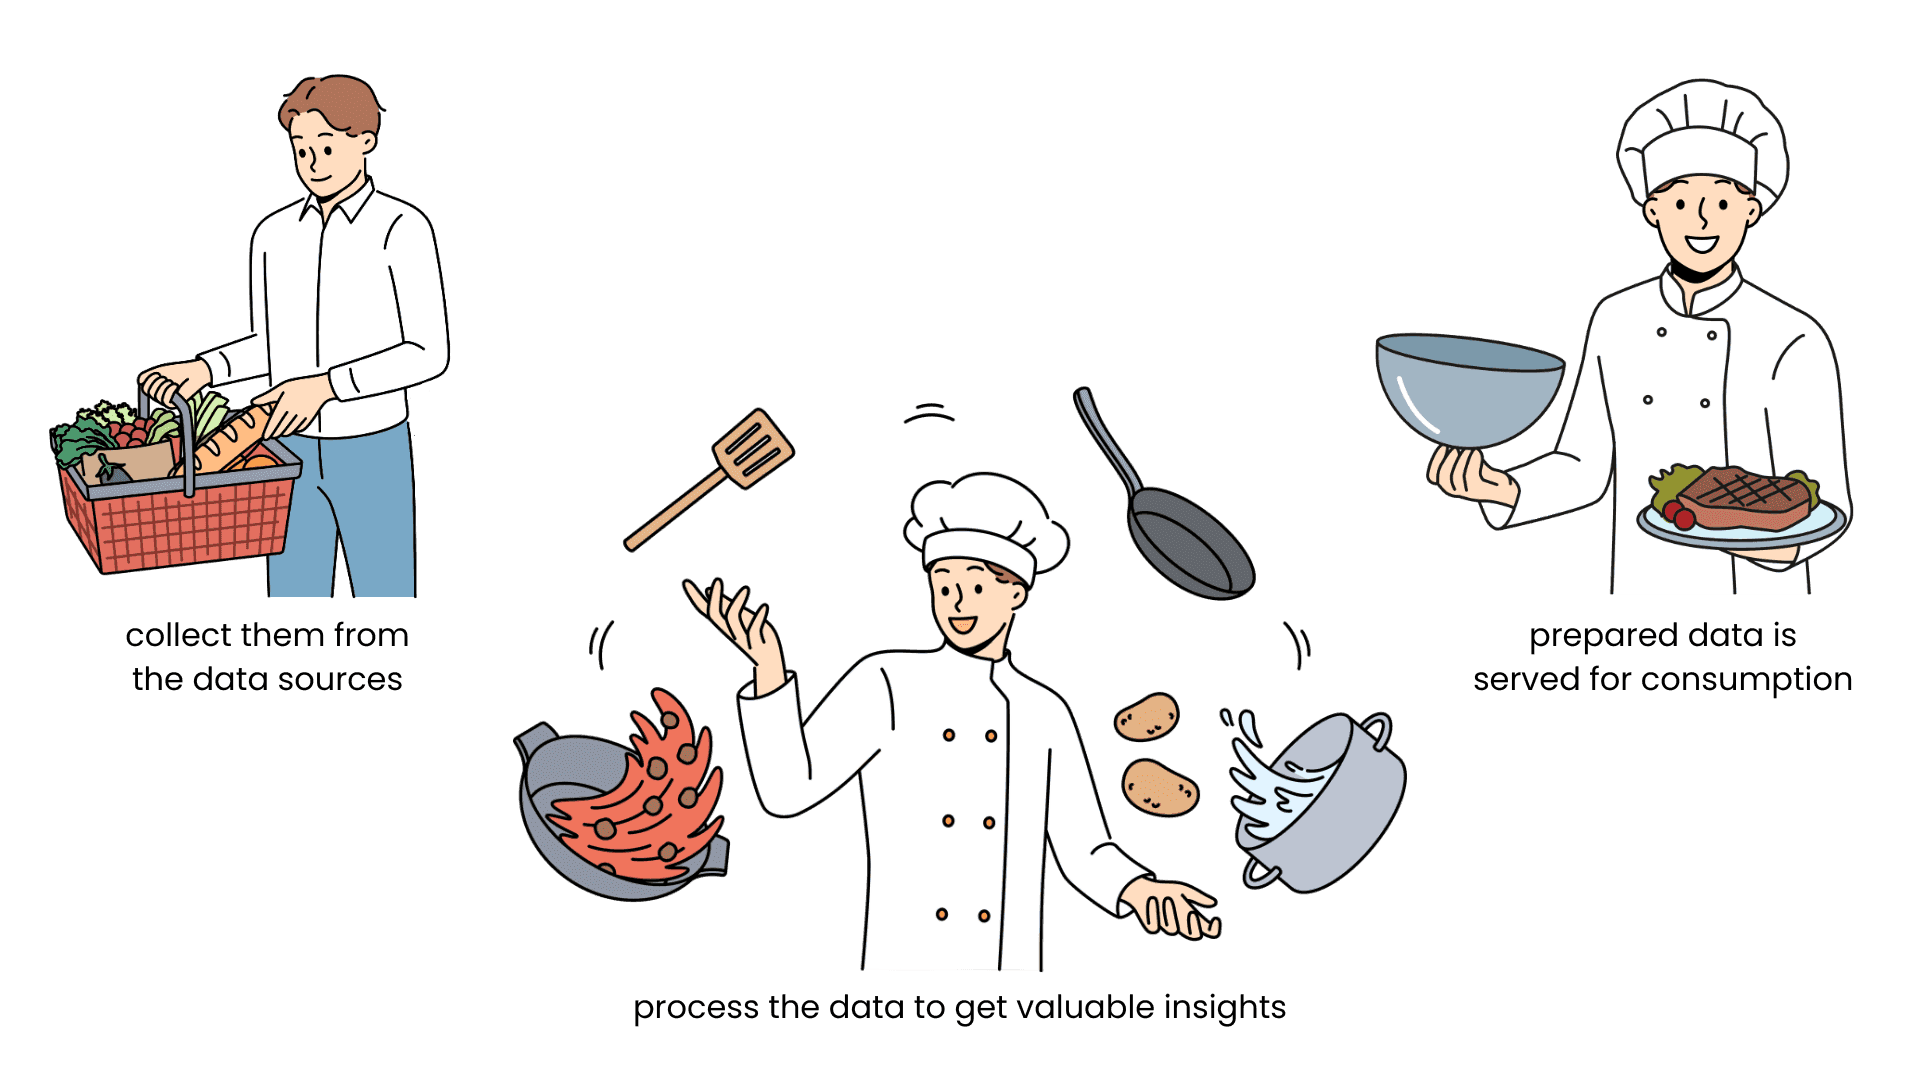
Preparing raw data for consumption is like preparing a dish; the raw ingredients (raw data) themselves aren’t of much use. You need to collect them from the store (data sources), need a recipe (a plan), and you need to prepare and cook those ingredients to create a dish that you can consume (process the data to get valuable insights).
The data stack is like the kitchen where all this happens. It includes everything from collecting and storing raw data, to the “oven” where data is processed, to the “dining table” where the prepared data is served for consumption.
Not all tools are equal in the data stack, and it’s of major importance to start with the foundation tools and then add by iteration once your data stack evolves. This illustration from Dylan Anderson (from this article) perfectly depicts this hierarchy of tools. In a nutshell, you should first focus on having tools that belong to the blue part of this pyramid.
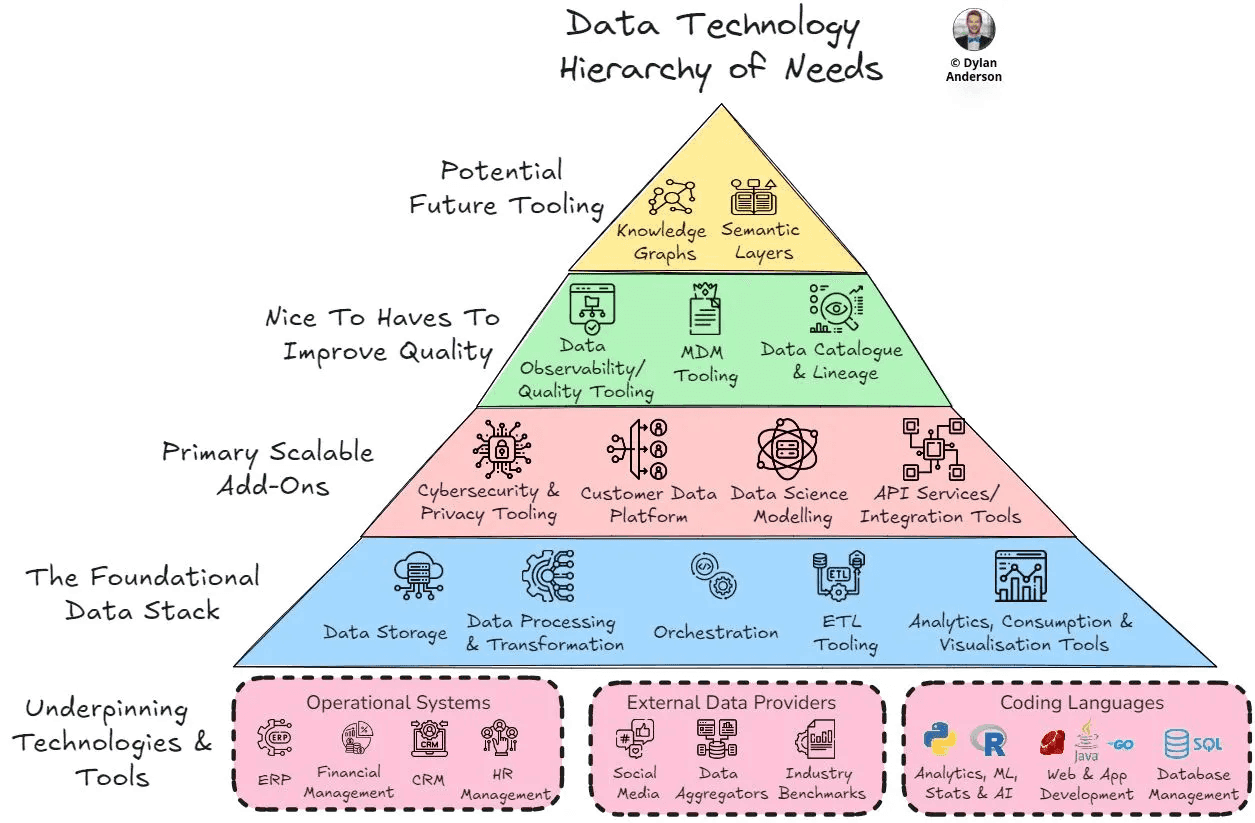
Once you have your foundational Data Stack up and running smoothly and seamlessly, you can start moving up the pyramid ladder.
Why open source (OSS)?
When we refer to an OSS data stack, we think about OSS solutions that allow us to build an efficient data stack. Alternatively, a data stack can also be built using a combination of proprietary tools and fully managed services. So why focus on a data stack built with OSS technologies?

OSS solutions are great for organizations with the technical skills to manage them while optimizing their costs. While they don’t provide top-quality customer support, the community around them ensures the quality of those solutions is high and maintenance is taken care of. Their OSS nature makes them agnostic and prevents vendor lock-in.
As mentioned at the beginning of this article, our accelerator removes the Cons associated with OSS and makes it accessible for any data teams to deploy OSS solutions.
Technicalities
This section will describe the main technical components of this accelerator without going into too much technical jargon and complex explanations. Ultimately, this accelerator exists to abstract away the complexity of deploying such OSS applications.
The following architecture provides a comprehensive overview of how we deploy and host OSS in a scalable and production-grade manner.
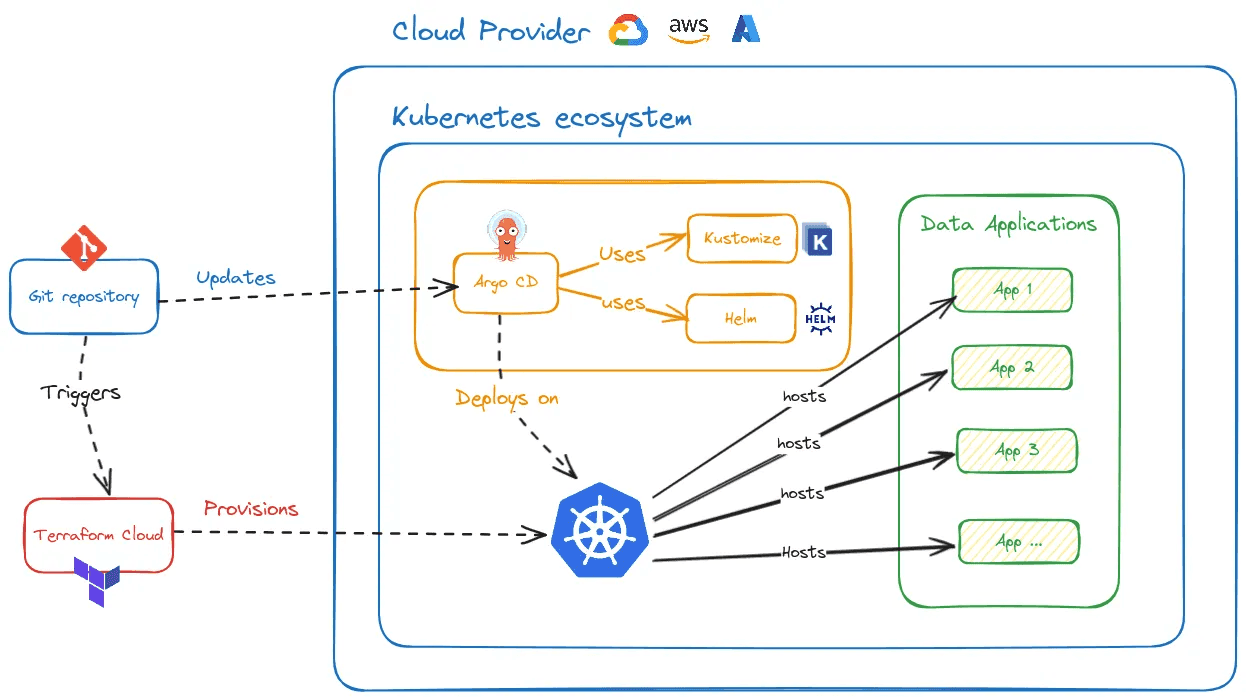
The different components will be detailed in subsequent sections, but the key characteristics of this architecture are:
Automation: this was our main concern when starting this accelerator; if we cannot automate everything, then adoption will be tough. Using Git as a source of truth and having it trigger Terraform and ArgoCD automatically, our solution is 100% automated, as every code change gets automatically deployed. Want to upgrade to the latest release of the OSS tool? Just change the release version in the helm chart, do a commit and push, and then watch your tool being seamlessly upgraded.
Scalability: this design can handle any kind of workload as it is based on Kubernetes with auto-scaling in mind. Ultimately, it depends on the cloud provider you choose to host Kubernetes, but mainstream cloud providers will automatically scale your Kubernetes cluster nodes.
Cloud agnostic: this solution can be deployed on any cloud provider as the underlying architecture relies exclusively on Kubernetes technologies. All mainstream cloud providers have a fully managed Kubernetes product to accommodate this solution.
Kubernetes ecosystem: this solution revolves around OSS tools from the CNCF (Cloud Native Computing Foundation) with Kubernetes at its core. Kubernetes has proven to be the leading and most robust OSS system to host containerized applications and is here to stay.
Git as the source of truth
As developers with a strong focus on DevOps, having git as a source of truth was a no-brainer. Different git repositories are used for different purposes. All those repositories are always integrated with a CI/CD pipeline or directly integrated with a deployment tool to trigger actions upon changes in the code. Our different repositories:
Cloud resources: various resources must be deployed on your chosen cloud provider (Kubernetes cluster, storage bucket, etc.). Those resources are deployed using Terraform (cloud agnostic), and using Terraform Cloud, you can have the repository trigger the plan automatically upon changes in the code.
Data OSS applications: One repository for each application and those repositories contain every time the same structure with the Helm chart and Kustomize code to deploy the OSS application.
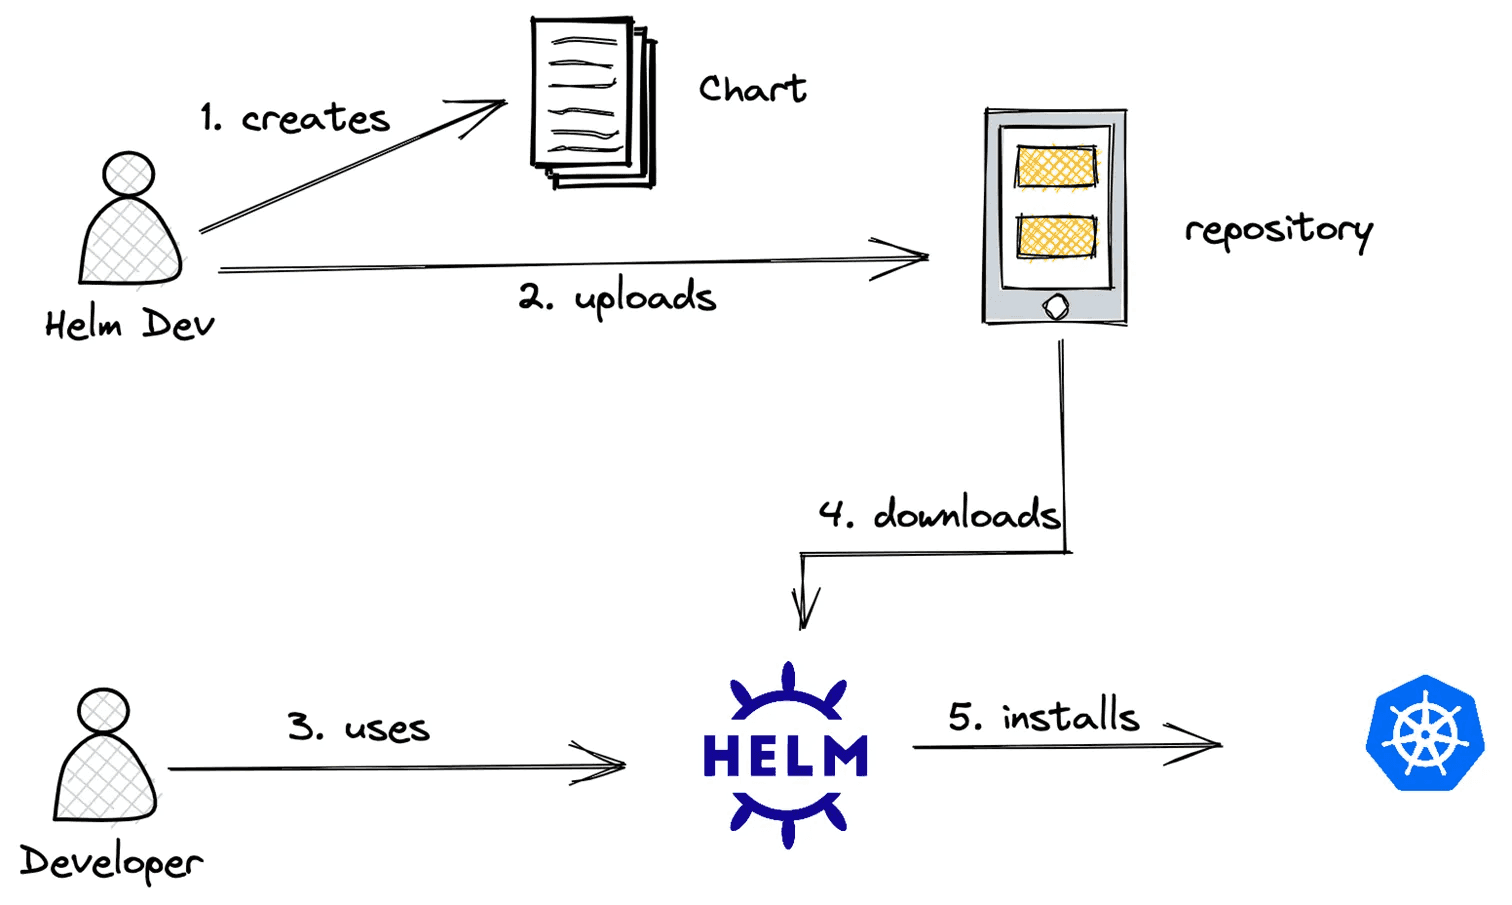
Helm
Deploying OSS applications on Kubernetes can be very tedious, but Helm charts simplify this by abstracting the deployment process. A chart contains all the Kubernetes objects to deploy a specific application on your Kubernetes cluster. Every popular OSS application has a helm chart and can be used with the default values to be deployed on a Kubernetes cluster. Helm charts consist basically of yaml files and one value file that you can customize to your needs for the deployment.
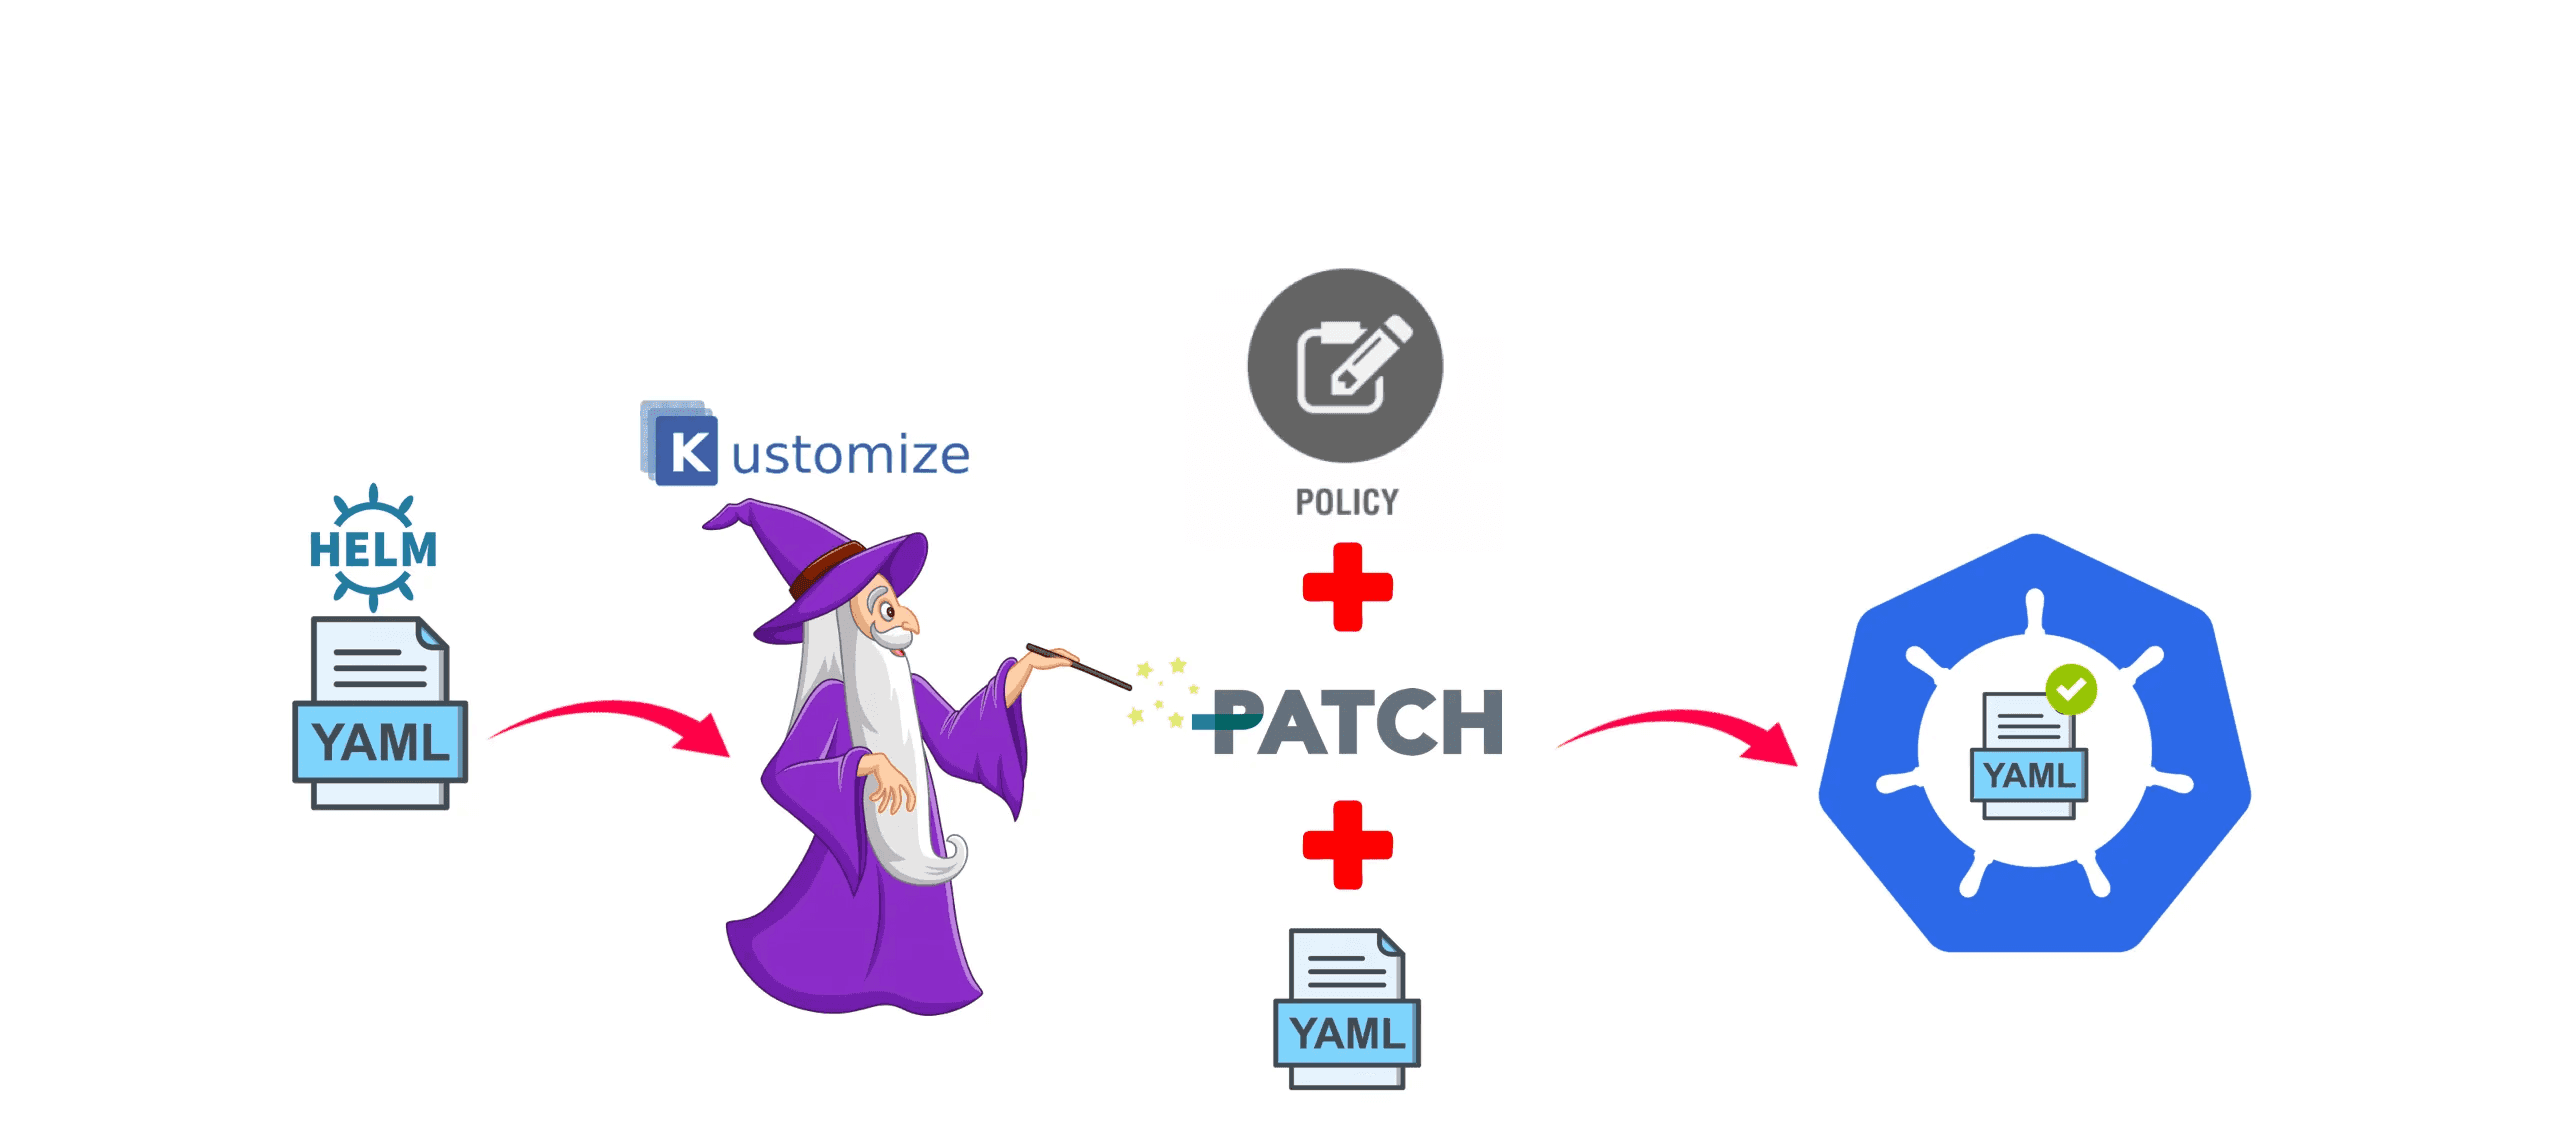
Kustomize
There are some limitations to what you can customize on the helm charts of the OSS applications, and for this reason, a tool named “Kustomize” was developed to fill that gap. With Kustomize, you can basically amend/patch everything you want to make the deployment of the OSS applications meet your specific needs. The following illustration depicts well how Helm and Kustomize work together.
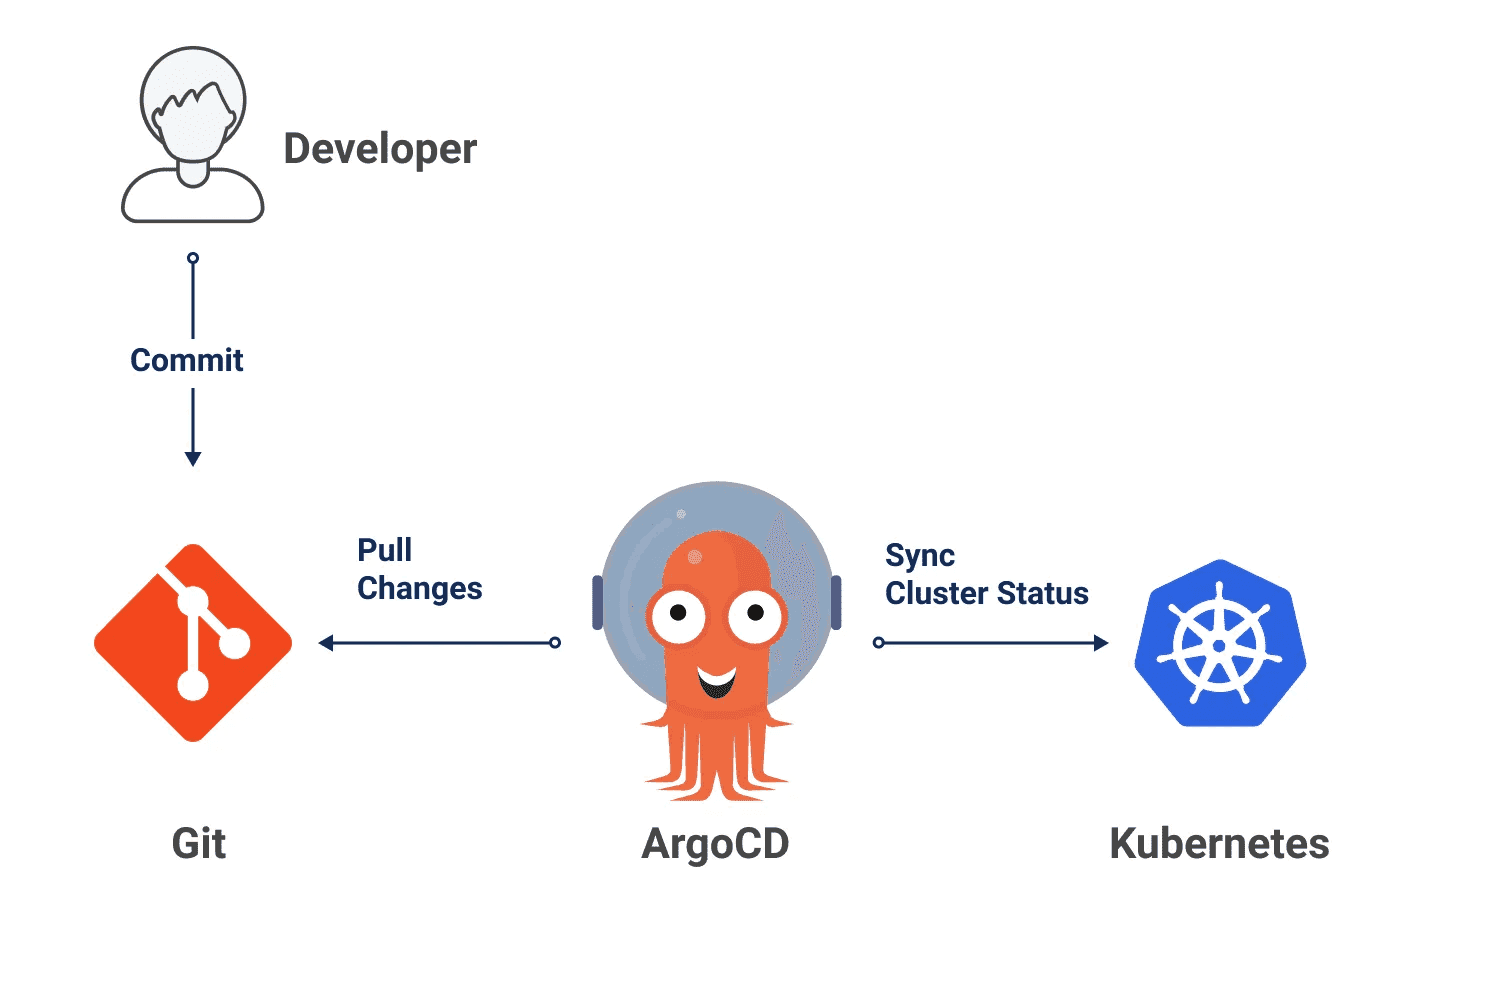
Argo CD
Last but certainly not least is Argo CD. It is the heartbeat for deploying and monitoring the health of your deployment. It continuously listens to the git repositories containing your helm charts, and as soon as it detects a change, it will synchronize this change onto the cluster.
Monitoring & Alerts
Efficient monitoring and alerting are essential not only to maintain performance but also to understand and leverage the business implications of the data stack. By monitoring key metrics and data flows, we can make informed decisions, improve resource management, and demonstrate and ensure compliance with regulatory requirements. Basically, monitoring a modern data stack is useful for keeping the technical side healthy but also for using all that information and exploiting the data to drive business growth and success.
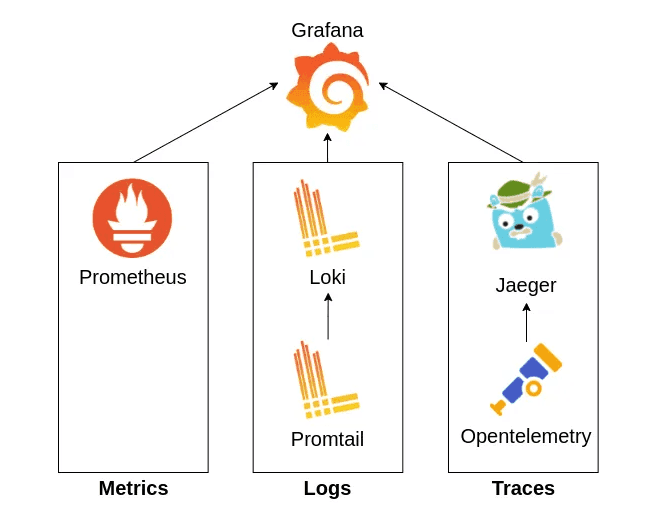
We leverage tools such as OpenTelemetry for collecting and transmitting cluster and application metrics, Prometheus for storing and gathering metrics from various data sources, including application databases, and Grafana for creating custom visualizations and diverse dashboards and utilizing their alert manager to notify us via Slack and email. We opted for these tools due to their OSS nature, strong community support, and compatibility with any private cloud infrastructure. This decision ensures reliable maintenance and freedom from vendor lock-in.
What to monitor?
In the following, we will describe what we consider essential to monitor from Astrafy, aligned with the industry standard concept of the four golden signals. Thus, it has a solid monitoring base recognized by the industry’s leading icons.
Infrastructure health:
Pod Health: Monitoring the health and status of the pods provides an overview of the availability and reliability of the services and applications deployed in our environment. Unhealthy pods can negatively affect service quality and user experience.
Error Rates: Tracking error rates and anomalies in cluster components helps us identify potential problems before they become serious. This allows us to take preventive measures to avoid business interruptions and maintain the quality of our data processes.
Resource Utilization: Monitoring resource utilization helps us to identify bottlenecks and optimize resource allocation, avoiding overloads and waste of resources that could financially affect our operation.
Security: Monitoring the integrity and security activities of the cluster allows us to detect unauthorized access attempts or security breaches, thus protecting our data and applications from potential threats. In addition to providing a clear view of these elements, it is useful and necessary for auditing purposes.
Traffic: It is essential to monitor the traffic between all the elements of our stack. This monitoring provides us with a complete view of system performance, identifying potential bottlenecks and performance issues and ensuring an optimal user experience. In addition, traffic analysis is crucial to obtain solid technical results and ensure excellent usability in our applications and services.
Data Journey:
Duration: Monitoring the duration of data pipelines is essential to optimize data processing efficiency. Unexpected variations in duration can indicate inefficiencies or problems affecting time-sensitive business processes.
Batch Processing: Monitoring batch data processes ensures the whole process until the data is ready to be consumed. Detecting failures in batch synchronization is crucial to maintaining data integrity and ensuring that systems are up to date with the latest information.
Streaming Processing: Monitoring streaming data ingestion processes is essential for real-time data flow. Monitoring failures in streaming synchronization and data ordering helps ensure continuous data availability and accuracy, supporting informed decision-making and analysis, which can be crucial for finance, for example.
We have designed metrics and dashboards to avoid falling into the trap of having an overwhelming amount of metrics that, in the end, everyone ignores. We keep it lean, and we develop ad-hoc metrics/dashboards for specific debugging.

Alerts
Monitoring can be overwhelming, so it is critical to use alerts effectively. While dashboards are useful for retrospective analysis, alerts allow us to act quickly on problems. It is important to design appropriate alerts to warn us of critical situations, avoiding excessive alerts that may dilute their importance.
Using the appropriate tools, we can design the necessary alerts to meet our needs, creating different types such as the following:
Failed Ingestion Pipeline Alert: This is crucial as it directly affects data availability and reliability.
Data quality threshold alerting: Data quality issues can arise from data sources, transformations, or loading processes. These issues should be reviewed as soon as possible to avoid subsequent errors or inaccuracies in analysis and reporting.
Resource utilization alerts: Configuring alerts related to resource consumption helps ensure optimal performance and scalability in the MDS infrastructure. Alerts triggered by bottlenecks or exceeding predefined thresholds can help prevent slowdowns, downtime, or failures.
Pipeline latency alerting: Essential for meeting service level agreements (SLAs) and ensuring information availability. Like the others, the objective of these alerts is to enable prompt action in undesired situations.
Moreover, leveraging the data collected through monitoring and alerts opens up the opportunity to build a data product that can be integrated into machine learning models for predictive analytics. By analyzing historical performance data and identifying patterns of incidents flagged by alerts, we can train machine learning algorithms to predict potential issues or anomalies before they occur. This proactive approach not only enhances our ability to respond swiftly to emerging issues but also empowers us to implement preventive measures, ultimately improving our systems’ overall reliability and stability.
Example of data Stack deployed
You can deploy any kind of stack with this solution; here is an example of a stack we have used to deploy at different customers, and that works pretty well. This stack covers the “foundational data stack” from the aforementioned hierarchy of needs pyramid.
Airbyte for ingestion: One of the most popular ingestion tools with hundreds of connectors ready to use. It also has a “no-code” connector builder to build new connectors in a matter of hours.
dbt for transformations: de-facto tool for data transformation. It actually doesn’t require any deployment on the Kubernetes cluster, as it is not an application but a framework. The idea here is to leverage the Kubernetes cluster to run the dbt jobs.
Metabase for BI: It does a great job for visualization and provides a lot of great features.
Airflow for orchestration: Airflow has been around for ten years and keeps getting traction and improving over time.
Datahub for data governance: Developed originally by LinkedIn, Datahub has emerged as one of the best data governance tools in the market. It is simple to use and integrates natively with many data stack applications.
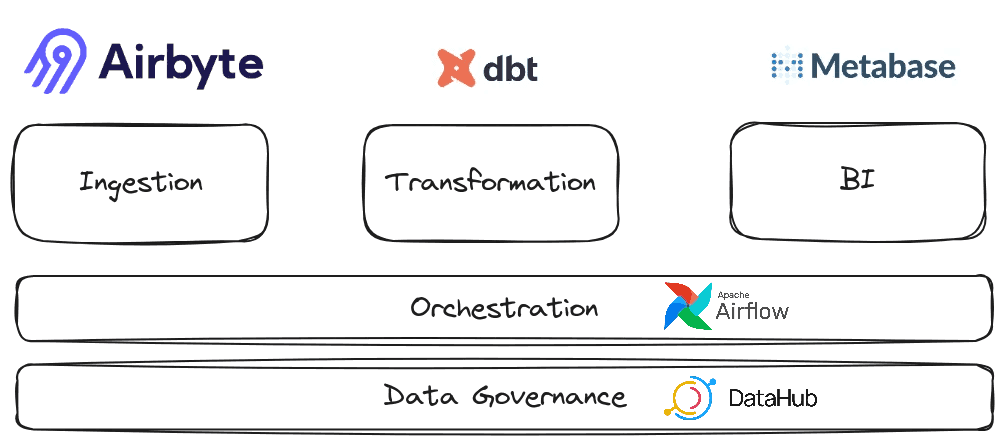
A strength of this stack is that all those tools integrate well together, and Datahub can act as the single pane of glass that monitors and navigates your data pipelines.
Replicability
A key benefit is that the entire stack used to deploy those OSS technologies is also OSS and that it can be deployed on different cloud providers to then deploy any kind of OSS data tools. And while this article focuses on OSS data tools, any OSS tools could be deployed. The only prerequisite is that the tool has a helm chart. Then, it’s just a matter of tweaking here and there to deploy it using the aforementioned Kubernetes stack.
The previous section described an example of a well-oiled working stack, but that’s the beauty of this solution — you can choose the stack you want.
Next steps
Check out our accelerator webpage and the one-pager dedicated to this data stack cluster accelerator.
As you can see, quite some infrastructure and DevOps skills are necessary to deploy and run those OSS solutions with production-grade features. The good news is that we have made such deployments dozens of times for various customers, and you can use our accelerator to get started on your OSS data stack journey. So, what’s the process?
You start by filling in a Google Form
We contact you and set up a meeting to discuss your needs
Conclusion
To conclude, the article effectively outlines the challenges and solutions associated with deploying OSS data stack technologies in a production-grade environment.
The proposed accelerator, leveraging Kubernetes, Git, and other OSS tools, provides a comprehensive solution for organizations that seek to harness the power of OSS software without the associated complexity. By abstracting the intricacies of infrastructure and DevOps, this accelerator enables companies to deploy robust and scalable data stacks that are tailored to their specific needs, all while remaining cloud-agnostic and avoiding vendor lock-in.
The flexibility and replicability of the solution underscore its value for companies of all sizes, particularly startups and SMEs looking to compete with larger enterprises. As the data landscape continues to evolve, tools like this accelerator will play a critical role in empowering businesses to innovate and scale efficiently.
Thank you
If you enjoyed reading this article, stay tuned as we regularly publish technical articles on Data Infrastructure, Kubernetes, and Google Cloud. Follow Astrafy on LinkedIn, Medium, and Youtube to be notified of the next article.
If you are looking for support on Modern Data Stack or Google Cloud solutions, feel free to reach out to us at sales@astrafy.io.
Written by

Charles Verleyen
CEO & Lead Architect


